Gráfico de categorias do WPF
Esse controle de gráficos habilitado para toque facilita a visualização de dados de categoria. Criado com base em um gráfico de dados de alto desempenho e rico em recursos, o gráfico de categorias filtra as complexidades da visualização de dados em uma API simplificada que qualquer pessoa pode usar.
Use o novo Ultimate UI para WPF Category Chart Configurator para configurar rapidamente o controle e associar dados diretamente do XAML, sem necessidade de código!
BAIXAR exemplos do WPFFácil vinculação de dados
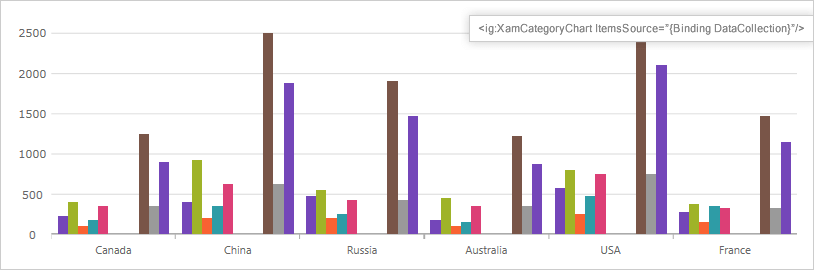
Associe uma coleção de dados (ou uma coleção de coleções) à propriedade ItemsSource e o gráfico analisará seus dados e escolherá automaticamente a melhor série para representá-los. O gráfico personalizará a aparência para você.
Uma ampla variedade de tipos de gráficos para escolher
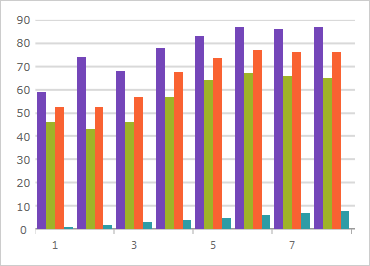
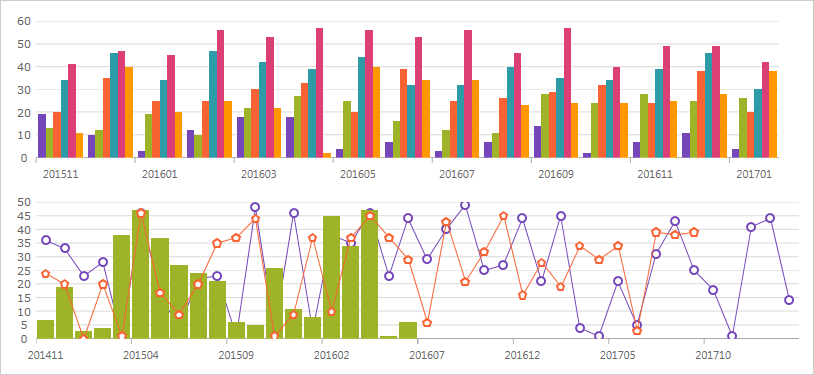
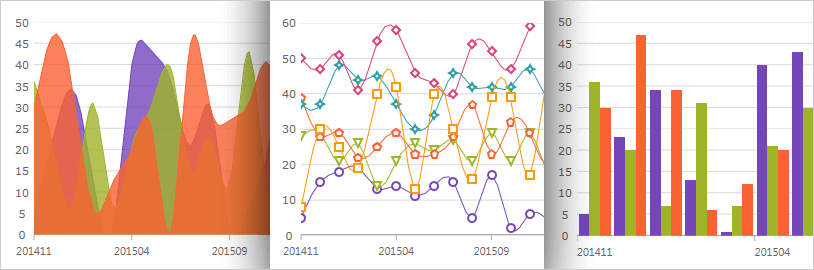
Aproveite ao máximo seus dados com um gráfico para cada necessidade, incluindo Linha, Área, Coluna, Ponto, Spline, Cascata e muito mais.
Inteligência e estilo por padrão
Você nem precisa definir rótulos com este controle intuitivo. O gráfico de categoria usará a primeira propriedade de cadeia de caracteres apropriada encontrada nos dados de seus rótulos. Os dados são analisados e a visualização apropriada é renderizada para você, de forma fácil e rápida, usando um adaptador de dados inteligente.
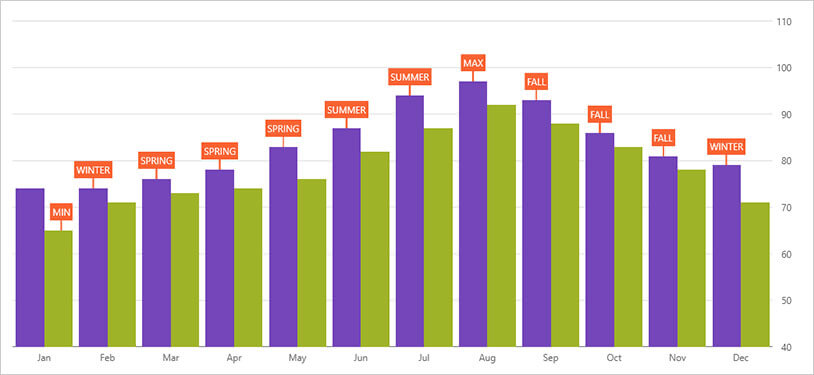
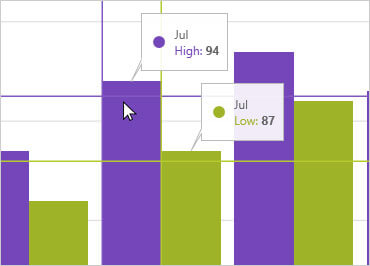
Camada de textos explicativos
Anote pontos de dados importantes ou personalize valores em caixas de texto explicativo com base em sua lógica (ou seja, calcule valores máximos em sua fonte de dados).
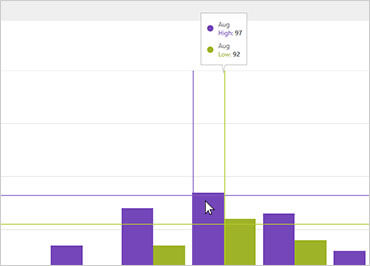
Linhas de mira
Renderiza uma linha horizontal, uma linha vertical ou ambas no local do cursor. As linhas de mira podem se ajustar a pontos de dados ou interpolar entre pontos de dados mais próximos do cursor.
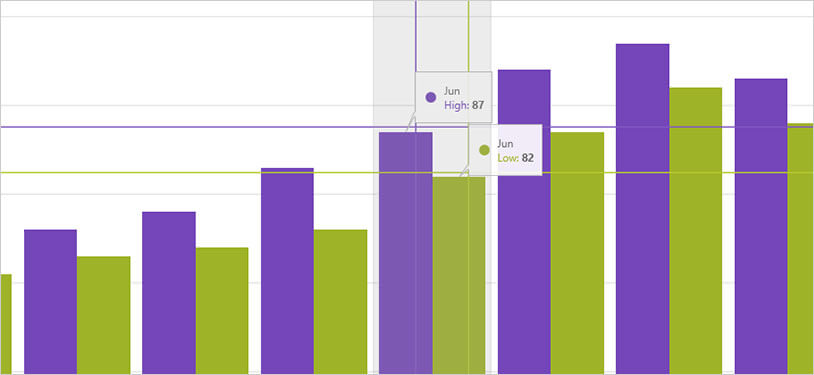
Anotação de mira
Mostra valores de ponto de dados no local do cursor e renderiza esses valores em caixas coloridas sobre rótulos dos eixos X e Y.
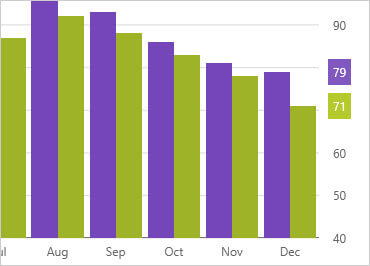
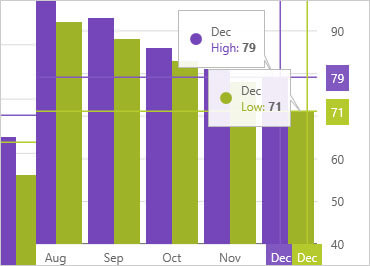
Anotação de valores finais
Mostra o valor do último ponto de dados em sua fonte de dados. Renderiza uma caixa colorida para cada fonte de dados em rótulos do eixo Y.
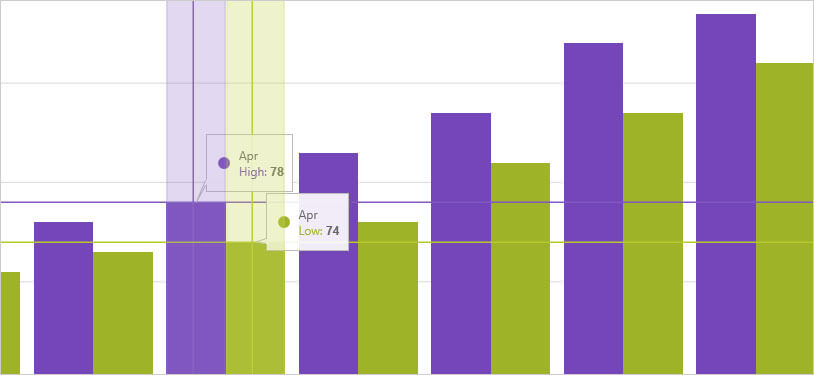
Camada de realce de categoria
Renderiza um retângulo vertical que estende a extensão da categoria mais próxima do cursor.
Camada de destaque do item
Renderiza um retângulo vertical semitransparente para itens de dados na categoria mais próxima do cursor.
Camada de dica de ferramenta de categoria
Renderiza uma dica de ferramenta combinada para todas as séries em uma categoria de dados.
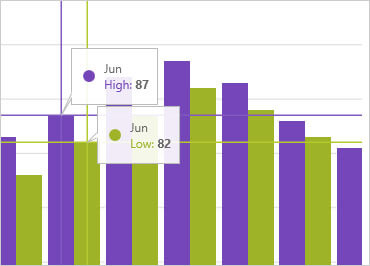
Camada de dica de ferramenta do item
Renderiza uma dica de ferramenta individual para cada série em uma categoria de dados.
Configurador de gráficos de categorias
Os configuradores de controle reduzem as horas de tempo de desenvolvimento, removendo a complexidade de aprender a API do Gráfico de Categorias. Configure visualmente todo o gráfico em uma experiência de apontar e clicar WYSIWYG. Permita que seus designers estilizem controles de forma interativa e visual para obter uma renderização perfeita de pixels de sua intenção de design.
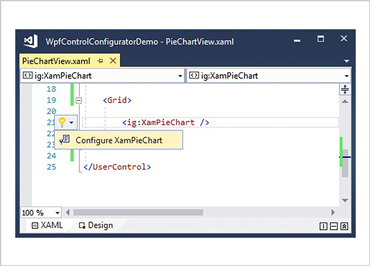
Inicie o Configurador de Gráfico de Categoria com um único clique
Selecione seu controle no editor XAML e use a lâmpada de ações sugeridas para iniciar o Configurador de Gráfico de Categoria.
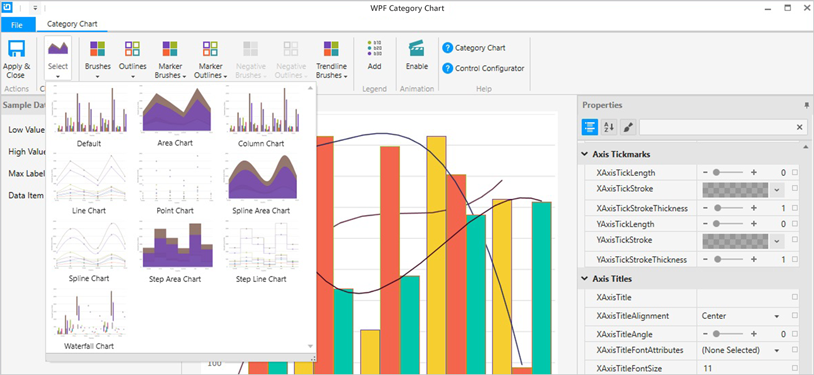
Configure visualmente seu gráfico de categorias
Use os itens da Galeria da Faixa de Opções para personalizar visualmente quase todos os aspectos do seu gráfico de categoria – desde o layout inicial do gráfico até a configuração de Interatividade, Layout, Pincéis e Legenda. Tudo sem precisar saber nada sobre a API do gráfico de categorias!
Escolha seu tipo de gráfico
Aproveite ao máximo seus dados com um gráfico para cada necessidade, incluindo Linha, Área, Coluna, Ponto, Spline, Cascata e muito mais.
Edição de propriedades com facilidade
Encontre convenientemente propriedades agrupadas por recursos relacionados no Editor de propriedades. Os recursos também são ativados ou desativados pela compatibilidade de recursos. Isso permite que você personalize qualquer detalhe do controle e ajuda você a aprender por exemplo, pois você pode ver em tempo real como suas alterações afetam o controle.
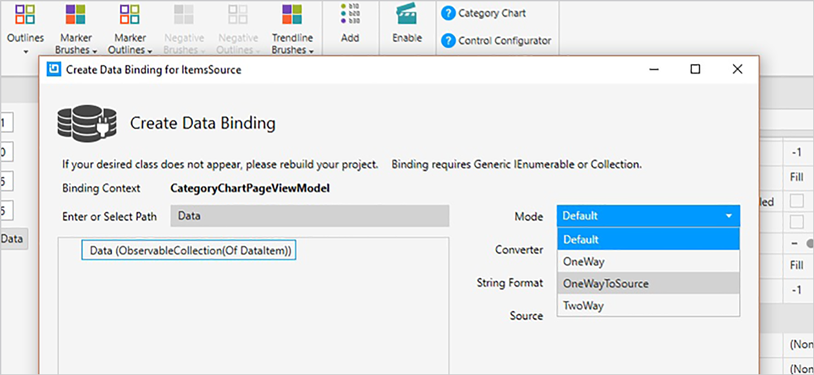
A vinculação de dados é muito fácil
Você pode adicionar rapidamente dados dinâmicos para inflar Baixo Valor, Alto Valor e Comprimento da Etiqueta. Use o Editor de Associação para definir facilmente uma associação para um controle, incluindo o modo de associação ou seu conversor personalizado. Fornecemos até um formatador útil para que você não precise pensar em como exibir seus valores.