
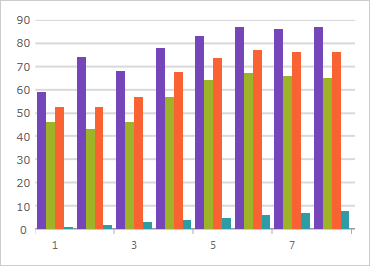
Gráfico de categorias do WPF
Esse controle de gráficos habilitado para toque facilita a visualização de dados de categoria. Criado com base em um gráfico de dados de alto desempenho e rico em recursos, o gráfico de categorias filtra as complexidades da visualização de dados em uma API simplificada que qualquer pessoa pode usar.
Saiba MaisGráfico de superfície 3D do WPF
O controle 3D Surface Chart permite visualizações de superfície 3D rápidas, visualmente atraentes e personalizáveis. O controle oferece um conjunto completo de opções de API para atender a qualquer requisito de plotagem de superfície 3D e padrões muito intuitivos para minimizar a codificação necessária.
Saiba Mais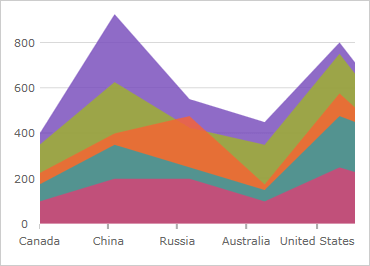
Gráfico de dados do WPF
Renderize gráficos do WPF com milhões de pontos de dados que são capazes de atualizações de milissegundos e não poupe nada para atingir uma velocidade incrível. Permita a visualização e análise de dados pesados em grandes volumes de dados com alto desempenho.
Saiba Mais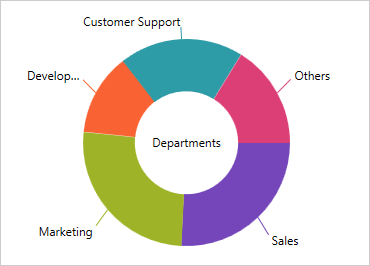
Gráfico de rosca do WPF
Exiba seus dados com várias séries usando este rico gráfico de rosca. Semelhante a um gráfico de pizza, o gráfico de rosca mostra estatísticas categóricas expressas em porcentagens. Com seu centro oco, é melhor para exibir várias séries usando anéis concêntricos, onde cada anel representa uma série de dados. Vincule-se facilmente aos dados, configure o raio interno, exiba fatias explodidas, personalize temas e muito mais com este controle completo.
Saiba Mais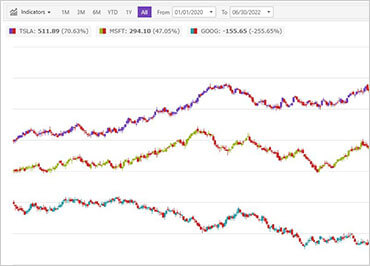
Gráfico financeiro do WPF
Configure facilmente dados financeiros com este gráfico leve para construir serviços financeiros de alto desempenho e alto volume e aplicativos de dados do mercado de capitais. Basta vincular seus dados, e o gráfico cuida de todo o resto.
Saiba Mais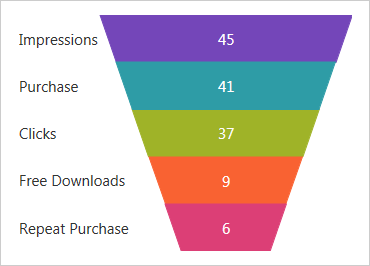
Gráfico de funil do WPF
Exiba visualmente valores decrescentes com nosso novo gráfico de funil, um gráfico de série única que exibe dados em forma de funil com um número variável de seções, cada uma representando os dados como diferentes partes de 100%. O gráfico de funil torna mais fácil para os usuários finais ilustrar as "consequências" de valor no processo de vendas ou gargalos no fluxo de um processo de várias etapas.
Saiba Mais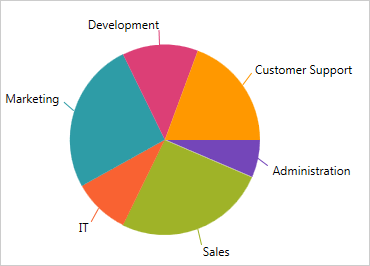
Gráfico de pizza do WPF
Crie gráficos de pizza simples ou explodidos. Personalize o limite para inclusão na categoria Outros e exiba rótulos de texto e imagens que podem estar dentro ou fora da pizza de uma maneira que evite sobreposição. Os usuários podem clicar ou detalhar para visualizar dados subjacentes, explodir uma seção do bolo e encontrar informações por meio de dicas de ferramentas.
Saiba Mais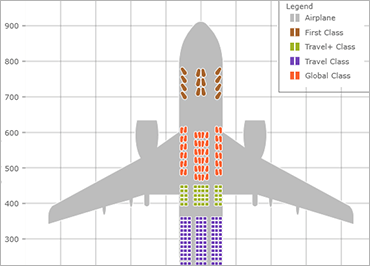
Tabela de formas do WPF
O Gráfico de Formas do WPF plota dados X/Y, incluindo dados de equilíbrio, de arquivos de forma ou qualquer forma personalizada que você possa definir. Ele expande a funcionalidade do controle Gráfico de Dispersão com suporte para duas visualizações de dados adicionais, Polilinha e Polígono. O adaptador de dados inteligente escolhe automaticamente a visualização correta para seus dados, ou você pode escolher entre Ponto, Bolha, Área, Contorno, Alta densidade, Linha, Spline, Polilinha ou Polígono.
Saiba Mais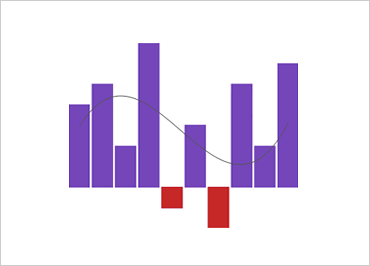
Minigráfico do WPF
O novo controle Sparkline é um gráfico simples e com uso intenso de dados que permite aos usuários finais identificar tendências, variações e padrões nos dados em uma representação clara e compacta.
Saiba Mais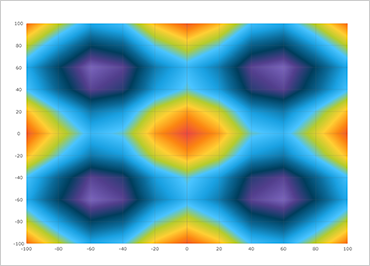
Gráfico de dispersão do WPF
O Gráfico de Dispersão do WPF (disponível como um controle CTP) é um gráfico leve e de alto desempenho que pode ser facilmente configurado para exibir dados de dispersão usando uma API simples e intuitiva. Basta vincular seus dados X/Y como uma coleção ou uma coleção de coleções, e o gráfico faz o resto. Escolha entre as visualizações de Ponto, Bolha, Área, Contorno, Alta densidade, Linha ou Spline.
Saiba Mais