
Gráfico de funil do Windows Forms
Exiba visualmente valores decrescentes com o controle Gráfico de Funil, um gráfico de série única que exibe dados em uma forma de funil com um número variável de seções, cada uma representando os dados como partes diferentes de 100%. O gráfico de funil torna mais fácil para os usuários finais ilustrar as "consequências" de valor no processo de vendas ou gargalos no fluxo de um processo de várias etapas.
Um gráfico de funil exibe as quantidades como porcentagens de um todo. Os gráficos de funil são comumente usados para exibir dados quantitativos em relação aos estágios de um processo. Por exemplo, um gráfico de funil pode exibir as despesas de um produto desde o estágio de fabricação até a venda real desse produto.
Baixar amostras do Windows Forms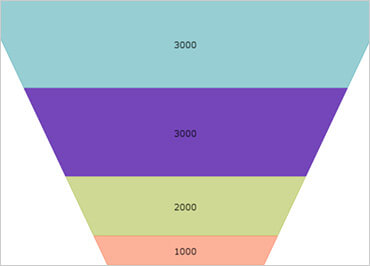
Seleção de fatias
O gráfico de funil permite que os usuários selecionem fatias individuais do funil. Isso permite que os usuários interajam com o gráfico de funil de várias maneiras, incluindo eventos de acionamento nos quais seu aplicativo pode agir.
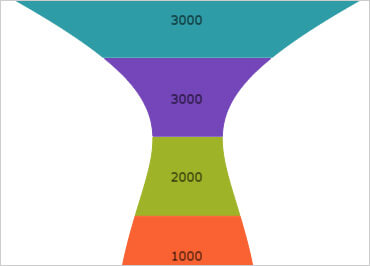
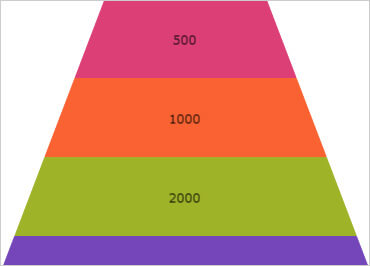
Funil Invertido & Arc
Inverta o funil para exibi-lo como uma pirâmide ou faça com que os lados do funil se curvem para dentro ou para fora em uma curva de Bézier.