
Minigráfico do Windows Forms
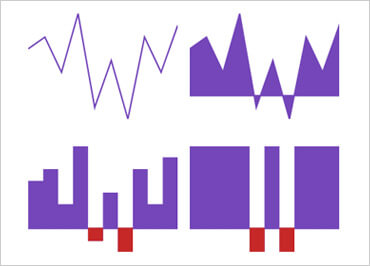
O controle Minigráfico do Windows Forms é um controle de gráfico leve que pode ser autônomo ou renderizar dados em um layout de pequena escala, como uma célula de grade. O controle Minigráfico renderiza os seguintes tipos de gráfico:
Baixar amostras do Windows Forms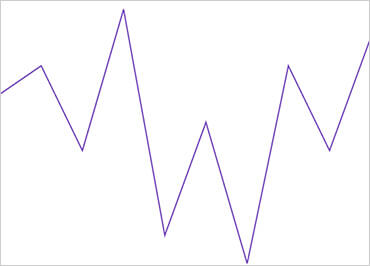
Linha
Exibe o tipo de gráfico de linhas do Minigráfico com dados numéricos, conectando os pontos de dados com segmentos de linha.

Área
Exibe o tipo de gráfico de área do Minigráfico com dados numéricos. Isso é semelhante a um tipo de gráfico de linhas, com a etapa adicional de fechar a área após cada linha ser desenhada.
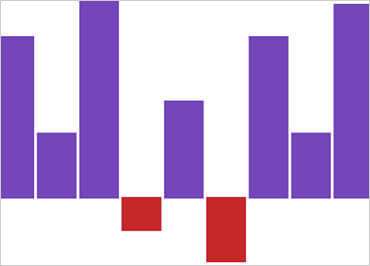
Coluna
Exibe o tipo de gráfico de colunas do Minigráfico com dados numéricos. Alguns podem se referir a isso como Barras Verticais.

Derrota
Esse tipo é visualmente semelhante ao tipo de gráfico de colunas, no qual o valor de cada coluna é igual ao máximo positivo (para valores positivos) ou ao mínimo negativo (para valor negativo) do conjunto de dados. A ideia é indicar um cenário de vitória ou derrota.