
Ignite UI Gráfico Financeiro
Este gráfico leve e de alto desempenho é fácil de configurar para exibir dados financeiros de missão crítica usando uma API simples e intuitiva. Basta vincular seus dados e o gráfico cuida de todo o resto. O controle Ignite UI Financial Chart faz parte da melhor interface do usuário da Infragistics para a criação de serviços financeiros de alto desempenho e alto volume e aplicativos de dados do mercado de capitais.
Ver amostraSeleção automática de coluna de dados
O controle intuitivo analisa e seleciona automaticamente colunas de dados - coluna Data/Hora a ser usada para o eixo x e as colunas Abrir, Alto, Baixo, Fechar, Volume ou as cinco primeiras colunas numéricas para o eixo y.
Opções visuais para configuração e exibição de dados
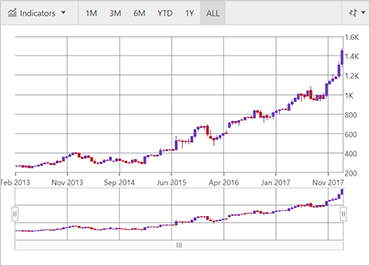
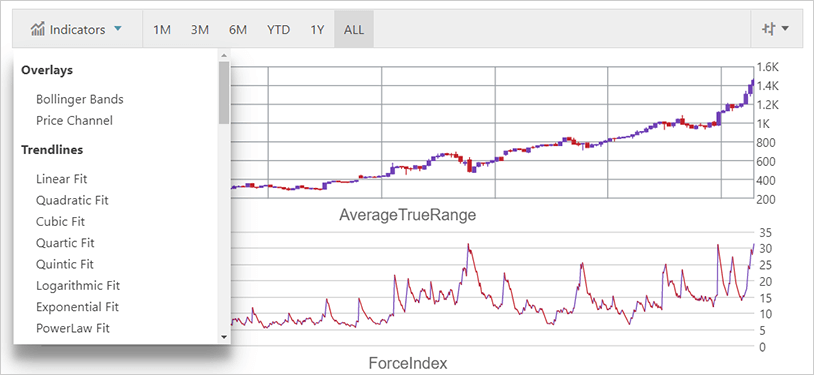
O Gráfico Financeiro apresenta uma barra de ferramentas que permite que os usuários finais escolham opções de exibição e seletores. Outras visualizações são a Visualização de Preços, a Visualização de Volume para volume de negociação, a Visualização de Indicadores e a Visualização de Navegação com barra de zoom para visualização.
 Ver amostra
Opções para visualizar dados
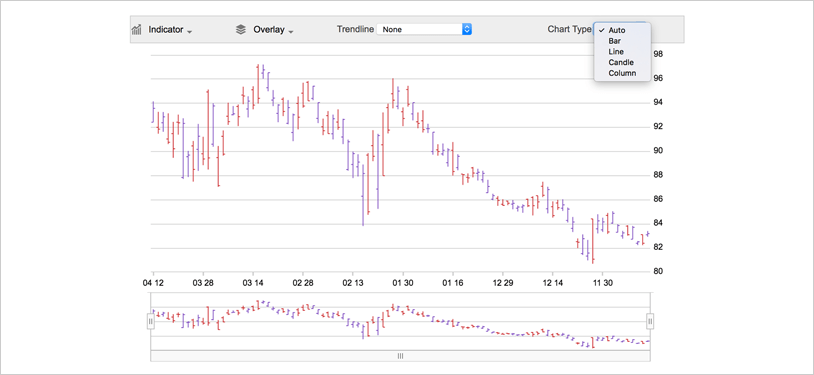
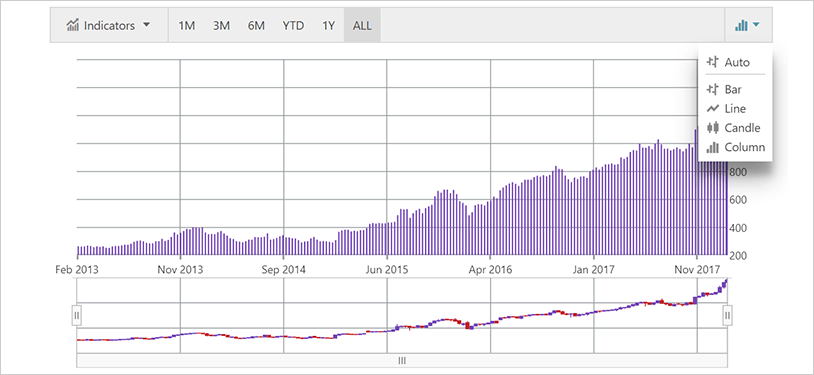
O gráfico oferece aos usuários várias maneiras de visualizar e interpretar dados, incluindo formatação de rótulos e vários modos de exibição de preço, volume e outros indicadores financeiros. Defina o chartType para designar gráficos de barras, velas, colunas ou linhas.
 Ver amostra
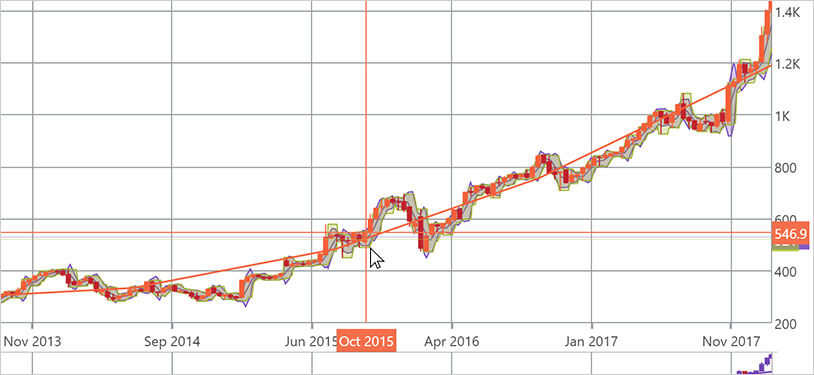
Anotação de mira
Mostra valores de ponto de dados no local do cursor e renderiza esses valores em caixas coloridas sobre rótulos dos eixos X e Y.
 Ver amostra
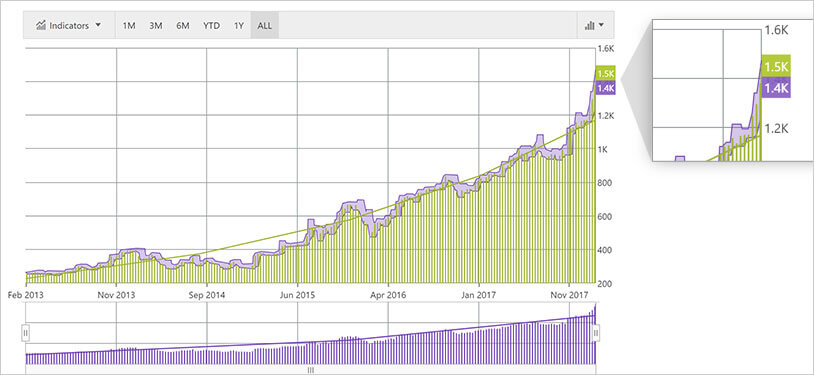
Anotação de valor final
Mostra o valor do último ponto de dados em sua fonte de dados. Renderiza uma caixa colorida para cada fonte de dados sobre o rótulo do eixo Y.
 Ver amostra
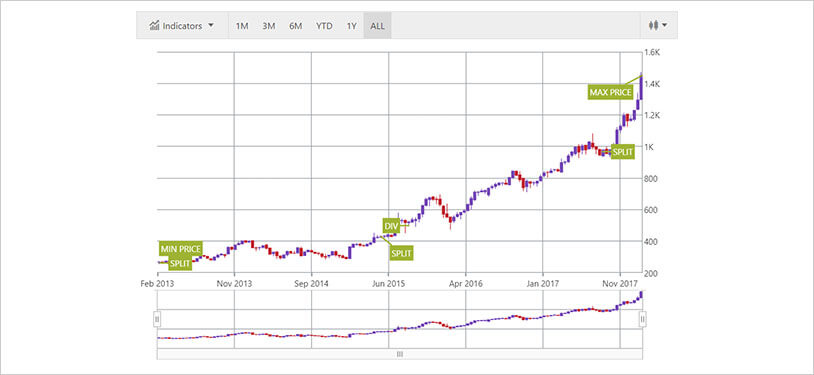
Camada de textos explicativos
Anote pontos de dados importantes ou personalize valores em caixas de texto explicativo com base em sua lógica (ou seja, calcule valores máximos em sua fonte de dados).
 Ver amostra
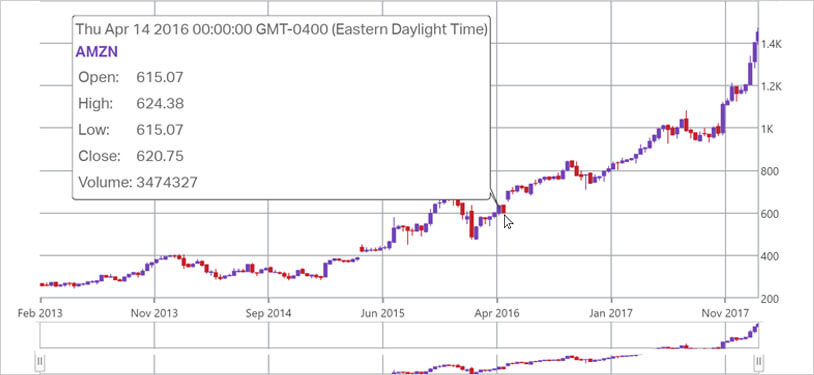
Camada de dica de ferramenta do item
Renderiza uma dica de ferramenta individual para cada série em uma categoria de dados.
 Ver amostra
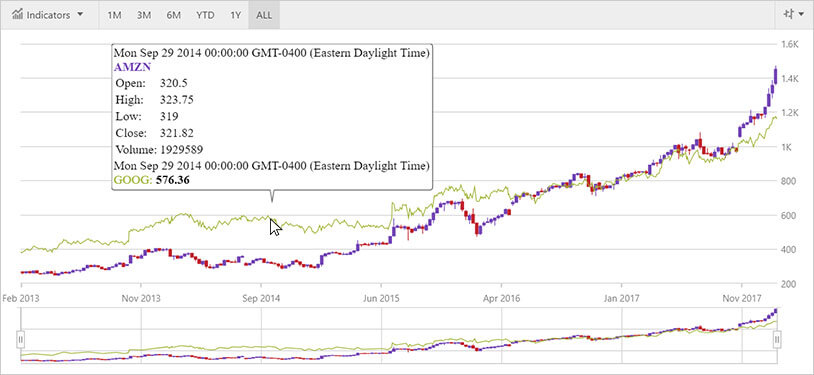
Camada de dica de ferramenta de categoria
Renderiza uma dica de ferramenta combinada para todas as séries em uma categoria de dados.
 Ver amostra
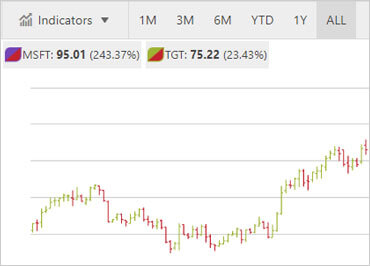
Lenda
O Gráfico Financeiro vem com uma legenda embutida exibida entre a barra de ferramentas e a área de plotagem. Essa legenda mostra os títulos da fonte de dados, bem como o último valor e a alteração percentual entre o primeiro item de dados e o último item de dados.
Ver amostra