Infragistics Blogs
Get the latest trends in low-code, app development, product updates and more. Here we share our knowledge, best advice, how-tos, research, insights, and more - all with the aim of helping you learn how to build better apps faster.

Seamlessly crafted for compatibility, Ignite UI for Angular is the library that enables you to leverage the power of the latest technologies and major releases. Committed to providing you with the best Angular UI toolkit and related insights, our goal is to equip you with more know-how, new features, enhanced performance, and improved stability.

This is just the beginning. We will continue to expand and refine both our open-source and premium controls so that every developer, from startup innovators to large enterprise teams, can build exceptional digital experiences with the right tools.
This release reinforces our commitment to performance, consistency, and modernization, while simultaneously empowering teams to design and develop with more speed, control, and cross-platform consistency than before.

Ignite UI for Angular 20.1 release is out, bringing tons of new enhancements. There are now powerful add-ons like cell merging, dual-side column pinning, and other improvements to the grids.
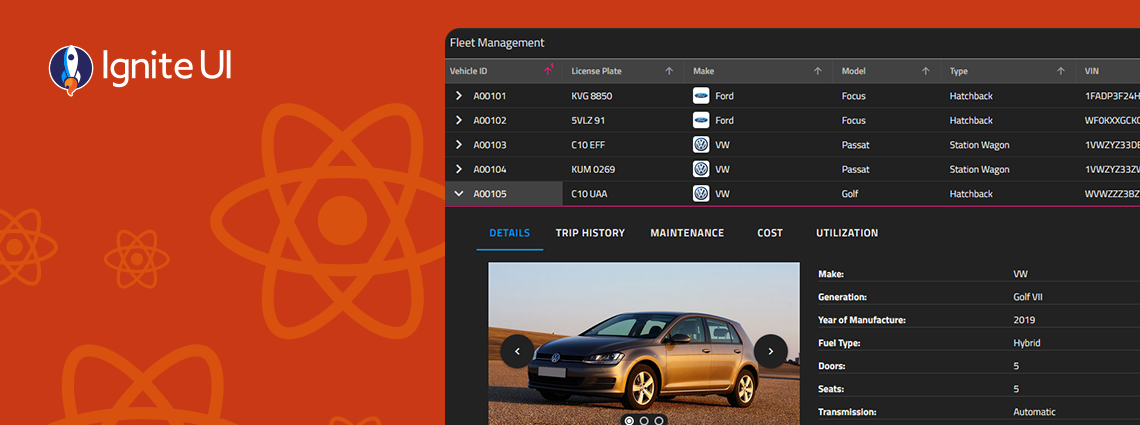
With Ignite UI for React 19, we’ve taken a major step toward delivering a more native, performant, and memory-efficient experience for React developers — without sacrificing the power, flexibility, and breadth our customers expect from Infragistics. See what's new.
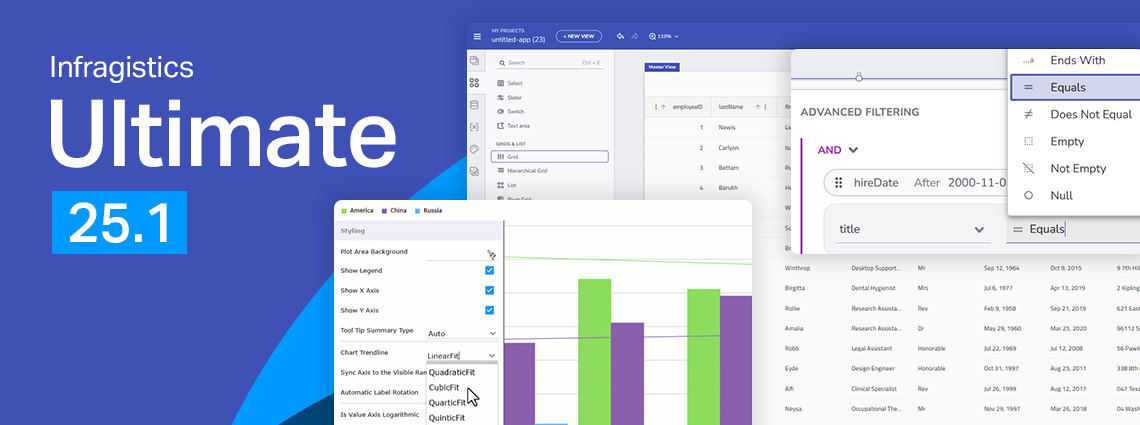
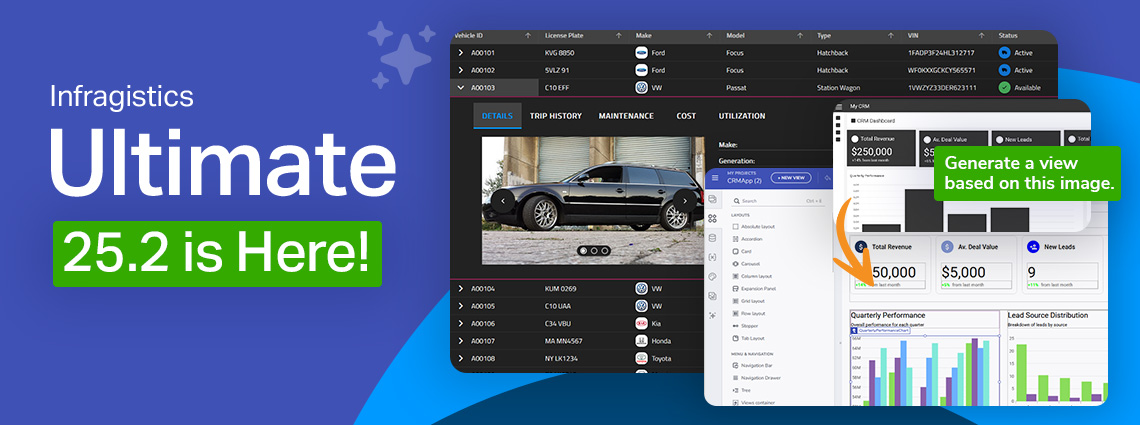
From brand-new components to exciting new features - here's everything you need to know about the Infragistics Ultimate 25.1 Release. Angular 19 updates, more charting capabilities, AI functionalities, and beyond.
We are extremely excited to introduce a brand-new charting functionality – Dashboard Tile. Learn how to use this charting feature to build interactive Dashboards with almost no hand-coding at all.

With the year coming to a close, we are reflecting on all the milestones and updates we've made. Here is Ignite UI 2024 in review. Read more in this blog post.
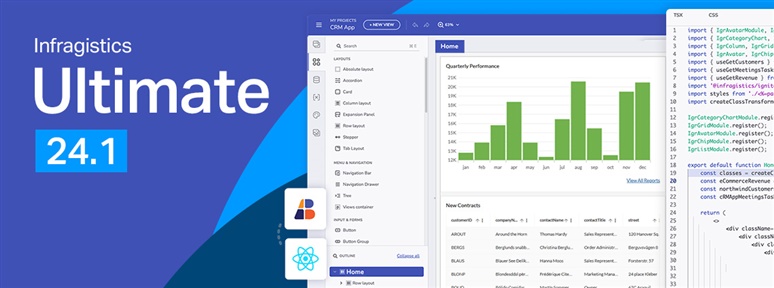
It’s release time and this time around Infragistics Ultimate 24.1 brings a host of new and much-anticipated features! See what’s new in our blog.
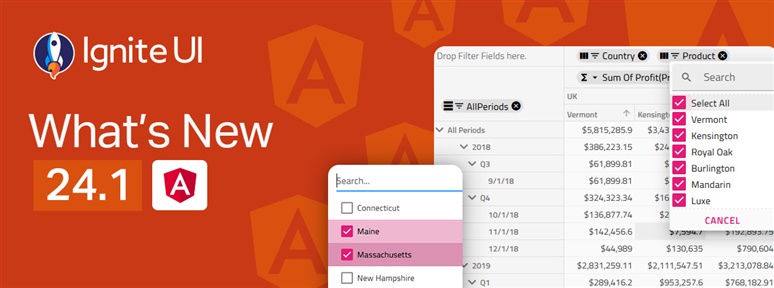
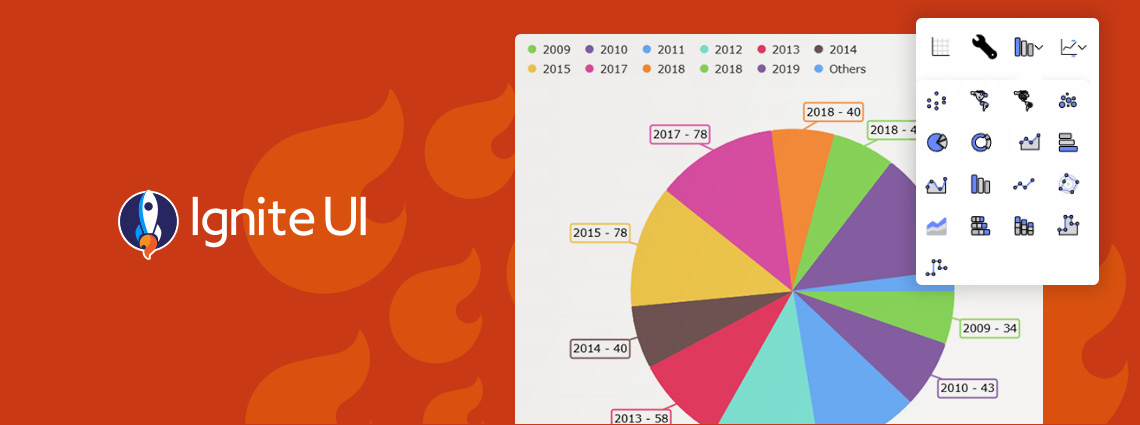
The latest release of Ignite UI is out and it brings tons of new features and components for Angular. Learn more about the updates and try the new capabilities.