How To Build XAML Doughnut Chart?
Os pacotes Infragistics para WPF e Silverlight contêm muitos gráficos diversos para visualização de dados. O controle que vamos ver é o gráfico de rosca.
Este gráfico suporta um ou mais anéis em torno de um centro em branco. Pode ser personalizado controlando os rótulos e cores das fatias ou configurando o raio interno. Neste blog, você pode aprender como adicionar esse controle ao seu aplicativo e como criar um gráfico hierárquico personalizado usando vários anéis.
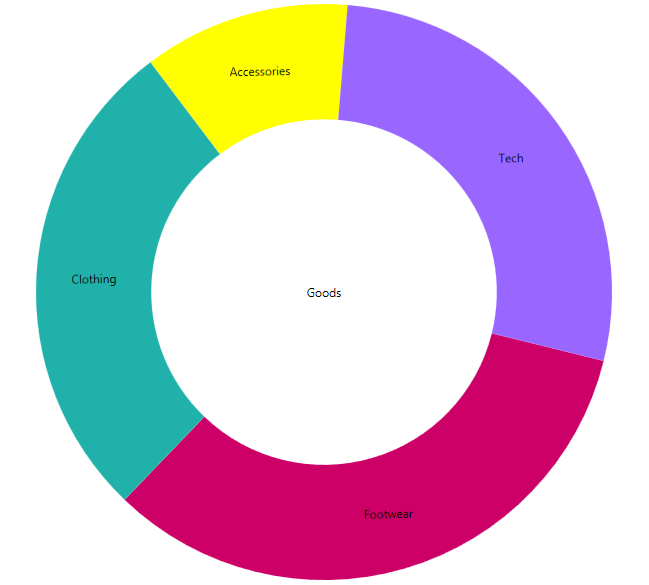
Adding the Doughnut Chart
Geralmente, quando você cria seu projeto WPF, a primeira coisa que você precisa fazer é adicionar as referências. Existe uma maneira fácil de fazer isso:
- Vá para a caixa de ferramentas. Lá você verá os controles NetAdvantage WPF e XAML compartilhado.
- Drag and drop the “XamDoughnutChart”.
Ao executar essas etapas, você verá que o Visual Studio adiciona automaticamente as referências de Infragistics necessárias.

Quando você arrastou "XamDoughnutChart", você realmente criou a tag necessária para hospedar nosso gráfico. A próxima etapa é incluir o seguinte código:
<ig:XamDoughnutChart x:Name="slice">
    <ig:XamDoughnutChart.Series>
        <ig:RingSeries
            LabelMemberPath="Label"
            ValueMemberPath="productionShare"
            LabelsPosition="BestFit"
            ItemsSource="{Binding Mode=OneWay, Source={StaticResource source}}">
        </ig:RingSeries>
    </ig:XamDoughnutChart.Series>
</ig:XamDoughnutChart>
A fonte de dados para os itens é gerada no arquivo cs da página da seguinte maneira:
public class Category
{
     public string Label { get; set; }
     public double productionShare { get; set; }
}

public class HierarchalDataCollection : List<Category>
{
     public HierarchalDataCollection()
     {
         this.Add(new Category { Label = "Footwear", productionShare = 46 });
         this.Add(new Category { Label = "Clothing", productionShare = 38 });
         this.Add(new Category { Label = "Accessories", productionShare = 16 });
     }
}
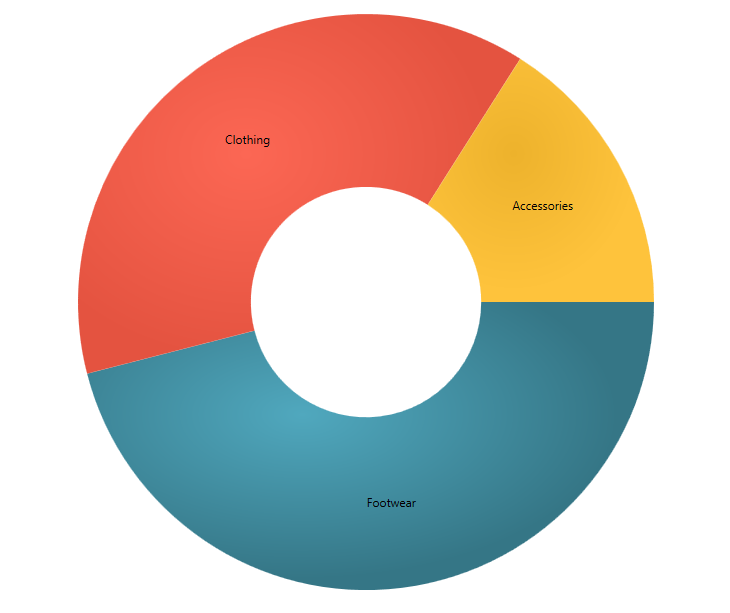
Basicamente, essas são as etapas para criar um gráfico de rosca. Claro que tem muitas opções como legenda, pincel, slice Select e Slice Explode, o que tornará seu gráfico ainda mais atraente. Mais sobre as opções você pode encontrar na documentação. Vou apenas dar uma dica de como adicionar uma opção específica. Por exemplo, se você quiser selecionar uma fatia e, assim, fazê-la explodir e alterar seu estilo, adicione as opções AllowSliceExplosion e AllowSliceSelection e defina seus valores como true. Em seguida, crie um evento slice click como esse:
XAML:
AllowSliceExplosion="True"
AllowSliceSelection="True"
SliceClick="slice_SliceClick"
C#:
private void slice_SliceClick(object sender, Infragistics.Controls.Charts.SliceClickEventArgs e)
{
    e.IsSelected = !e.IsSelected;
    e.IsExploded = !e.IsExploded;
}
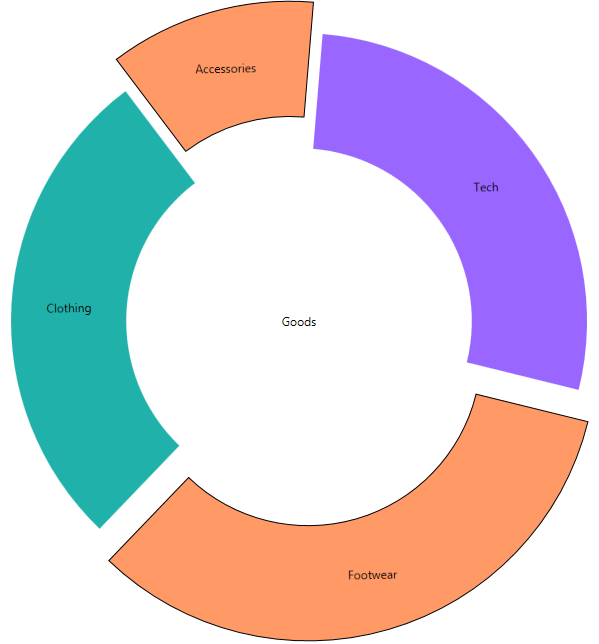
Gráfico hierárquico personalizado
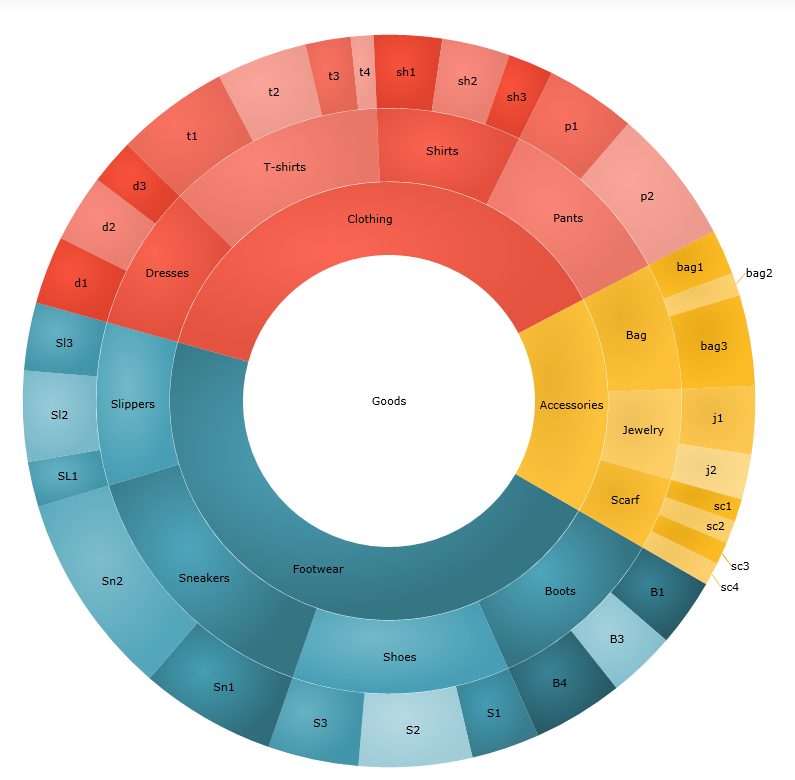
Quando você precisar visualizar dados hierárquicos, poderá usar a visualização de vários anéis do gráfico. Vamos criar um gráfico de rosca de três anéis, que exibirá as principais categorias divididas em subcategorias. Para isso, vamos criar três séries e definir nossa fonte de dados assim:
XAML :
<ig:XamDoughnutChart.Series>
    <ig:RingSeries
	StartAngle="30"
        LabelMemberPath="Label"
        ValueMemberPath="productionShare"
        LabelsPosition="BestFit"
        ItemsSource="{Binding Mode=OneWay, Source={StaticResource source}}"
        Loaded="RingSeries_Loaded">
    </ig:RingSeries>
    <ig:RingSeries
        StartAngle="30"
        LabelMemberPath="Label"
        ValueMemberPath="productionShare"
        LabelsPosition="BestFit"
        Loaded="RingSeries_Loaded"
        OthersCategoryThreshold="0" >
    </ig:RingSeries>
    <ig:RingSeries
        StartAngle="30"
        LabelMemberPath="Label"
        ValueMemberPath="productionShare"
        LabelsPosition="BestFit"
        OthersCategoryThreshold="0">
    </ig:RingSeries>
</ig:XamDoughnutChart.Series>
C# :
public class HierarchalDataCollection : List<Category>
    {
        public HierarchalDataCollection()
        {

            this.Add(new Category { Label = "Footwear"});
            this.Add(new Category { Label = "Clothing"});
            this.Add(new Category { Label = "Accessories"});
            this.Add(new Category { Label = "Tech" });


            this[0].Children.Add(new Category { Label = "Boots" });
            this[0].Children.Add(new Category { Label = "Shoes" });
            this[0].Children.Add(new Category { Label = "Sneakers" });
            this[0].Children.Add(new Category { Label = "Slippers" });

            this[1].Children.Add(new Category { Label = "Dresses" });
            this[1].Children.Add(new Category { Label = "T-shirts" });
            this[1].Children.Add(new Category { Label = "Shirts" });
            this[1].Children.Add(new Category { Label = "Pants" });

            this[2].Children.Add(new Category { Label = "Bag" });
            this[2].Children.Add(new Category { Label = "Jewelry" });
            this[2].Children.Add(new Category { Label = "Scarf" });

            this[3].Children.Add(new Category { Label = "PC"});
            this[3].Children.Add(new Category { Label = "Laptops"});
            this[3].Children.Add(new Category { Label = "Tablets"});
            this[3].Children.Add(new Category { Label = "Phones"});


            this[0].Children[0].Children.Add(new Category { Label = "B1", productionShare = 3 });
            this[0].Children[0].Children.Add(new Category { Label = "B3", productionShare = 3 });
            this[0].Children[0].Children.Add(new Category { Label = "B4", productionShare = 4 });

            this[0].Children[1].Children.Add(new Category { Label = "S1", productionShare = 3 });
            this[0].Children[1].Children.Add(new Category { Label = "S2", productionShare = 5 });
            this[0].Children[1].Children.Add(new Category { Label = "S3", productionShare = 4 });

            this[0].Children[2].Children.Add(new Category { Label = "Sn1", productionShare = 6 });
            this[0].Children[2].Children.Add(new Category { Label = "Sn2", productionShare = 9 });

            this[0].Children[3].Children.Add(new Category { Label = "SL1", productionShare = 2 });
            this[0].Children[3].Children.Add(new Category { Label = "Sl2", productionShare = 4 });
            this[0].Children[3].Children.Add(new Category { Label = "Sl3", productionShare = 3 });


            this[1].Children[0].Children.Add(new Category { Label = "d1", productionShare = 3 });
            this[1].Children[0].Children.Add(new Category { Label = "d2", productionShare = 3 });
            this[1].Children[0].Children.Add(new Category { Label = "d3", productionShare = 2 });

            this[1].Children[1].Children.Add(new Category { Label = "t1", productionShare = 5 });
            this[1].Children[1].Children.Add(new Category { Label = "t2", productionShare = 4 });
            this[1].Children[1].Children.Add(new Category { Label = "t3", productionShare = 2 });
            this[1].Children[1].Children.Add(new Category { Label = "t4", productionShare = 1 });

            this[1].Children[2].Children.Add(new Category { Label = "sh1", productionShare = 3 });
            this[1].Children[2].Children.Add(new Category { Label = "sh2", productionShare = 3 });
            this[1].Children[2].Children.Add(new Category { Label = "sh3", productionShare = 2 });

            this[1].Children[3].Children.Add(new Category { Label = "p1", productionShare = 4 });
            this[1].Children[3].Children.Add(new Category { Label = "p2", productionShare = 6 });


            this[2].Children[0].Children.Add(new Category { Label = "bag1", productionShare = 2 });
            this[2].Children[0].Children.Add(new Category { Label = "bag2", productionShare = 1 });
            this[2].Children[0].Children.Add(new Category { Label = "bag3", productionShare = 4 });

            this[2].Children[1].Children.Add(new Category { Label = "j1", productionShare = 3 });
            this[2].Children[1].Children.Add(new Category { Label = "j2", productionShare = 2 });

            this[2].Children[2].Children.Add(new Category { Label = "sc1", productionShare = 1 });
            this[2].Children[2].Children.Add(new Category { Label = "sc2", productionShare = 1 });
            this[2].Children[2].Children.Add(new Category { Label = "sc3", productionShare = 1 });
            this[2].Children[2].Children.Add(new Category { Label = "sc4", productionShare = 1 });


            this[3].Children[0].Children.Add(new Category { Label = "pc1", productionShare = 3 });
            this[3].Children[0].Children.Add(new Category { Label = "pc2", productionShare = 2 });
            this[3].Children[0].Children.Add(new Category { Label = "pc3", productionShare = 5 });

            this[3].Children[1].Children.Add(new Category { Label = "l1", productionShare = 4 });
            this[3].Children[1].Children.Add(new Category { Label = "l2", productionShare = 3 });

            this[3].Children[2].Children.Add(new Category { Label = "tab1", productionShare = 4 });
            this[3].Children[2].Children.Add(new Category { Label = "tab2", productionShare = 3 });
            this[3].Children[2].Children.Add(new Category { Label = "tab3", productionShare = 3 });
            this[3].Children[2].Children.Add(new Category { Label = "tab4", productionShare = 3 });

            this[3].Children[3].Children.Add(new Category { Label = "ph1", productionShare = 2 });
            this[3].Children[3].Children.Add(new Category { Label = "ph2", productionShare = 3 });
            this[3].Children[3].Children.Add(new Category { Label = "ph3", productionShare = 2 });
            this[3].Children[3].Children.Add(new Category { Label = "ph4", productionShare = 1 });
        }
    }
Agora temos todos os dados que queremos visualizar. Como estamos fazendo com que pareça hierárquico, seria bom se as diferentes fatias para cada categoria tivessem cores semelhantes. O que vamos fazer é pegar o pincel básico do anel mais interno e clareá-lo a cada passo. No código a seguir, você pode ver que primeiro descobrimos quantos filhos o anel tem e, em seguida, criamos uma coleção de pincéis que será uma combinação perfeita para as crianças.
private void RingSeries_Loaded(object sender, RoutedEventArgs e)
{
    var ringSeries = (sender as RingSeries);
    var count = ringSeries.Ring.ArcItems[0].SliceItems.Count();
    var brushes = ringSeries.Brushes;
    BrushCollection brushesMatch = new BrushCollection();

    for (var i = 0; i < count; i++)
    {
        var childrenCount = (ringSeries.ItemsSource as List<Category>)[i].Children.Count();
        var child = (ringSeries.ItemsSource as List<Category>)[i].Children;

        var brush = brushes[i];

        for (var j = 0; j < childrenCount; j++)
        {
            double step = 1 / (double)childrenCount;
            Random rand = new Random();
                double val = (1 + j) * step - .3;

                brushesMatch.Add(brush.GetLightened(val));
        }
    }

    ringSeries.Chart.Series[ringSeries.Ring.Index + 1].Brushes = brushesMatch;
}
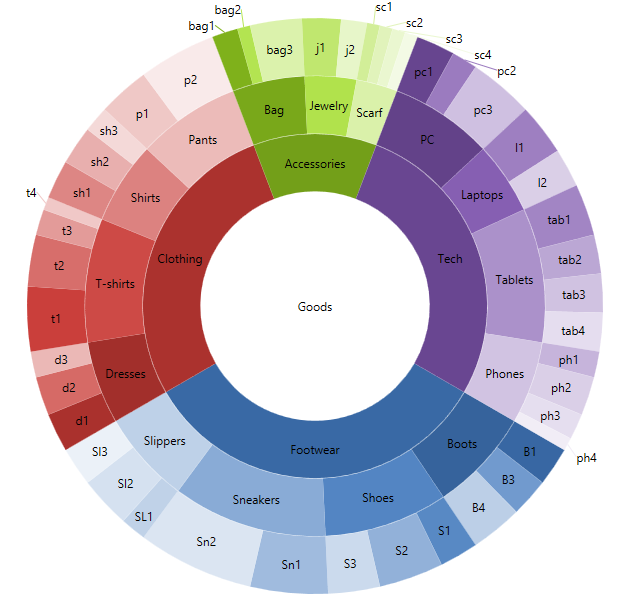
Dependendo dos dados que você vai exibir, você pode alterar a forma como as crianças são coloridas, por exemplo, você pode pinçá-las em tonalidade aleatória. Não importa que tipo de pincel você use - Gradiente Sólido, Radial ou Linear, o método de extensão GetLightend irá lidar com isso.
private void RingSeries_Loaded(object sender, RoutedEventArgs e)
{
    var ringSeries = (sender as RingSeries);
    var count = ringSeries.Ring.ArcItems[0].SliceItems.Count();
    var brushes = ringSeries.Brushes;
    BrushCollection brushesMatch = new BrushCollection();

    for (var i = 0; i < count; i++)
    {
        var childrenCount = (ringSeries.ItemsSource as List<Category>)[i].Children.Count();
        var child = (ringSeries.ItemsSource as List<Category>)[i].Children;

        var brush = brushes[i];

        for (var j = 0; j < childrenCount; j++)
        {
            Random rand = new Random();

            if (j % 2 == 0)
            {
                double val = Math.Round((rand.NextDouble() / 4), 2);
                brushesMatch.Add(brush.GetLightened(-val));
            }
            else
            {
                double val = Math.Round((rand.NextDouble() / 3), 2) + 0.2;
                brushesMatch.Add(brush.GetLightened(val));
            }
        }
    }

    ringSeries.Chart.Series[ringSeries.Ring.Index + 1].Brushes = brushesMatch;
}
Se você quiser saber mais sobre o gráfico de rosca, confira a página do produto.
A WPF sample and Silverlight sample.
Você pode nos seguir no Twitter@ Infragisticse manter contato noFacebook,Google+eLinkedIn!