

 Ivaylo Barakov
AI coding assistants can put together a WPF screen in seconds, but they do not know Ultimate UI for WPF as well as they sound like they do. The XAML usually looks right until you run it: a made-up xmlns URI fails the build, and so does a property borrowed from a different control. A misspelled enum value is harder to catch, because it compiles without a warning and fails only when the window opens. The assistant has no reliable source for the exact API, so it fills the gaps from memory.
That is where the Infragistics WPF MCP server comes in. It gives the assistant that source: the real component registry, the full API reference, the WPF documentation, and the theme resources, so the code it writes is grounded in the product you ship.
In this walkthrough, we:
- Install the server and connect it to GitHub Copilot or Claude Code.
- Build a WPF order dashboard from a single prompt.
- See which lookups the assistant made along the way.
- Refine the dashboard with follow-up prompts.
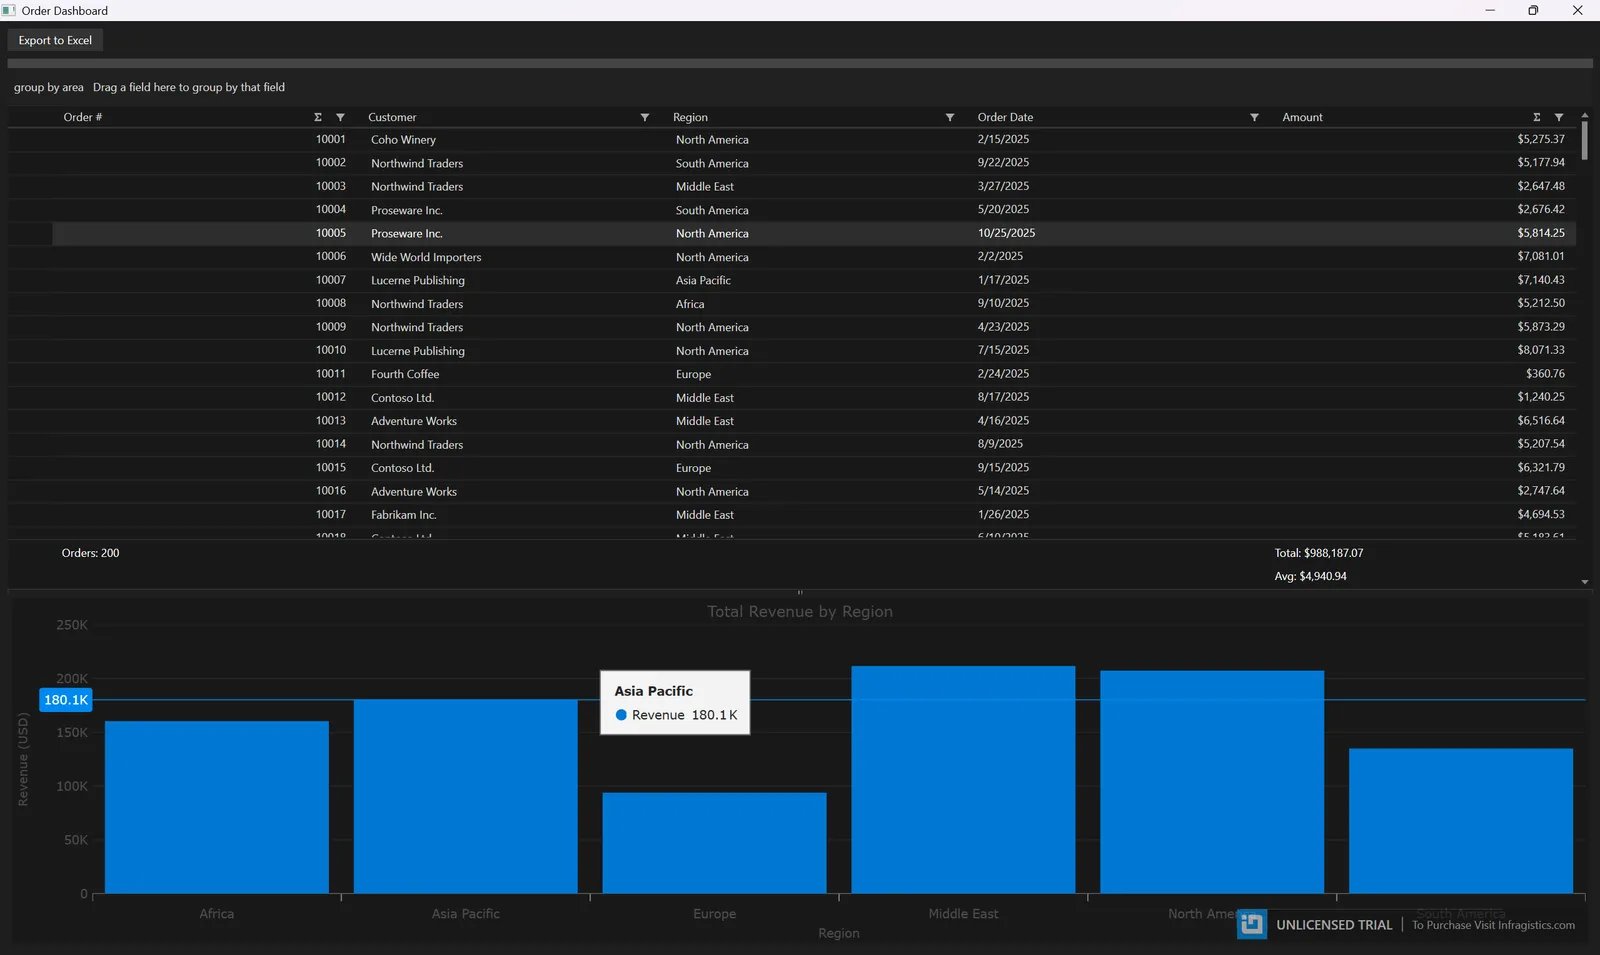
The result is an order dashboard with a feature-rich XamDataGrid, a XamCategoryChart, and one theme across the whole app, built against the real Ultimate UI for WPF API.
TL;DR
- What it is: a free, read-only MCP server that gives AI assistants the real Ultimate UI for WPF API: 189 Xam* controls, 5,300+ public controls and classes, 2,600+ documentation topics, and both theming systems.
- Install:
dotnet tool install -g Infragistics.Wpf.Mcp --prerelease. It needs the .NET 10 SDK, and--prereleaseis required while the server is in beta. - Works with: GitHub Copilot in Visual Studio and VS Code, Claude Code, and other MCP clients.
- What changes: XAML with the right namespaces, property names, and enum values, instead of guesses that fail at build time or when the window opens.
- Best fit: WPF teams who build with Ultimate UI for WPF and use an AI coding assistant.
What Is the Infragistics WPF MCP Server?
The Model Context Protocol (MCP) is an open standard that lets AI assistants call external tools. The Infragistics WPF MCP server is a set of those tools, built for Ultimate UI for WPF. When you ask for a grid, a chart, or a theme, the assistant looks up what it needs instead of guessing.
Here is what it knows:
- 189 Xam* controls, each with its XAML namespace URI and NuGet package
- 5,300+ public controls and classes, with their properties, enum values, events, methods, and inherited members
- 2,600+ documentation topics, including the XAML samples from the WPF help
- Both theming systems: named themes applied through
ThemeManager, and the legacyTheme="..."styles
That knowledge sits behind nine tools, and the assistant decides which one to call as it works.
| Tool | What it does |
|---|---|
list_wpf_components |
Lists the Xam* controls with their XAML namespaces and NuGet packages |
search_wpf_api |
Finds controls and classes by keyword when you know the feature but not the name |
get_wpf_api_reference |
Returns everything about one control or class: its properties and their allowed values, events, methods, and inherited members, or just the members you ask for |
search_wpf_docs |
Searches the how-to documentation by keyword and control |
get_wpf_doc |
Returns the full text and XAML samples of one documentation topic |
get_wpf_project_scaffold |
Generates the dotnet new and dotnet add package commands and xmlns declarations for a new project |
setup_wpf_theme |
Lists the named themes and returns ready-to-paste steps to apply one |
get_wpf_theme_resource |
Returns the XAML of a theme’s styles and templates, whole, page by page, or just the entries you ask for |
get_wpf_theme_palette |
Returns a theme’s color palette and the verified steps to recolor the theme |
There is no account, license key, or API key to set up. Everything the server knows ships inside the package, so it works offline and your code never leaves your machine. Every tool is read-only, so the server only looks things up. Your assistant makes the edits, and you review them like any other change.
What We Are Building
The demo application is an order dashboard for a sales team, built with Ultimate UI for WPF. The finished app includes:
- A XamDataGrid bound to a list of orders
- Typed columns with date and currency formatting
- Excel-style filtering from the column headers
- An Outlook-style group-by area above the grid
- Summaries on the numeric columns
- A XamCategoryChart with revenue by region
- The RoyalDark theme on every control
This is the type of screen that takes real time to assemble by hand, especially while you are still learning the grid’s field layouts, filter and summary settings, and theme setup. Those settings, together with the XAML namespaces, are also where AI-generated WPF code usually breaks.
With the Infragistics WPF MCP server connected, the assistant looks those details up instead of guessing them.
Installing the Infragistics WPF MCP Server
The server is a .NET tool on NuGet, Infragistics.Wpf.Mcp, and it needs the .NET 10 SDK or newer. It is currently in beta, so install it with --prerelease:
dotnet tool install -g Infragistics.Wpf.Mcp --prereleaseWithout --prerelease, NuGet reports the package as not found.
That gives you a wpf-mcp command. Run it once in a terminal to check that it starts. It prints a line like this and then waits for an MCP client:
Infragistics WPF MCP server 0.1.0-beta.1 ready (data: Infragistics 26.1.21, built 2026-10-26)Press Ctrl+C to stop it. From here on, your AI assistant starts it for you.
You can also skip the install and let dnx fetch and run the server on demand. While the server is in beta, include the version:
dnx Infragistics.Wpf.Mcp@0.1.0-beta.1 --yesConnecting Your AI Assistant
Visual Studio (GitHub Copilot). Add a .mcp.json file next to your solution, or to %USERPROFILE%\.mcp.json to make it available in every solution:
{
  "servers": {
    "infragistics-wpf": {
      "type": "stdio",
      "command": "wpf-mcp"
    }
  }
}
Open Copilot Chat, switch to Agent mode, and select Tools. The Infragistics tools are listed there. Visual Studio can add new tools turned off, so turn them on.
VS Code (GitHub Copilot). Put the same JSON in .vscode/mcp.json.
Claude Code. Add a .mcp.json file to the root of your project:
{
  "mcpServers": {
    "infragistics-wpf": {
      "command": "wpf-mcp"
    }
  }
}
Approve the server when Claude Code asks, then type /mcp in the chat to check that infragistics-wpf is connected. This works in the CLI and in the VS Code extension. If the claude command is on your PATH, you can run claude mcp add infragistics-wpf -- wpf-mcp instead. The VS Code extension does not add it to your PATH.

The /mcp panel in the Claude Code extension, with the server loaded from the project’s .mcp.json.
Other clients, such as Claude Desktop or Cursor, use the same mcpServers shape. If you went with dnx instead of the global install, use "command": "dnx" and "args": ["Infragistics.Wpf.Mcp@0.1.0-beta.1", "--yes"].
Prompting the Assistant to Build the Dashboard
The first prompt can be simple but specific. The goal is to tell the assistant:
- Which controls to use
- Which data to show
- Which grid features to enable
- What the chart should show
- Which theme to apply
Start from an empty folder. The prompt could look like this:
Use the Infragistics WPF MCP server.

Create a new WPF app called OrderDashboard.

Add an Order record (OrderId, Customer, Region, OrderDate, Amount) and 200 sample orders.

Show the orders in a XamDataGrid with typed columns and currency formatting for Amount.

Enable Excel-style filtering from the column headers, a group-by area above the grid, and summaries on the numeric columns.

Below the grid, add a XamCategoryChart that shows total revenue by region as a column chart, with a title, a Y axis title, and a Y axis that starts at zero.

Apply the RoyalDark Infragistics theme to the whole application.
We ran this prompt in Claude Code in VS Code, with Claude Opus 5.5. It built the whole dashboard in about three minutes without stopping to ask a question, and the first build succeeded with no warnings or errors.
Depending on your assistant and model, it may also stop after creating the project and ask before it continues. If it stops, tell it to continue. If you prefer to review each part as it lands, you can also split the request into smaller prompts. The lookups below are the same either way.
What the Assistant Looked Up
The prompt reads like one request, but the assistant answers it with a series of lookups. In our run, it made 36 lookups across all nine tools, 34 of them before it wrote a single file, and it did not search the web once. This is the part the MCP server changes: the namespaces, property names, and enum values below come from the server’s answers, not from the model’s memory.
Grouped by tool, the lookups were:
| Tool | Calls | What it looked up |
|---|---|---|
list_wpf_components |
2 | XamDataGrid and XamCategoryChart |
setup_wpf_theme |
1 | RoyalDark’s apply steps and theme files |
get_wpf_project_scaffold |
1 | The project commands and XAML namespaces |
get_wpf_api_reference |
16 | FieldSettings, FieldLayoutSettings, SummaryDefinition, SummaryCalculator, CurrencyField, XamDataGrid, and XamCategoryChart, plus the group-by area and field formats |
search_wpf_api |
1 | The typed field classes (NumericField, CurrencyField, DateTimeField, TextField) |
search_wpf_docs |
7 | The keyword searches that found the topics below |
get_wpf_doc |
6 | Record filtering, row summaries, grouping, adding summaries to a field, chart data binding, and chart types |
get_wpf_theme_resource |
1 | Whether RoyalDark styles the window itself |
get_wpf_theme_palette |
1 | RoyalDark’s base colors |
For 12 of the 16 API lookups, the assistant passed a member filter, such as FieldSettings with “Filter” or XamCategoryChart with “YAxis”, and got back only the matching members instead of the whole class.
The Project Setup
The assistant resolves the control names with list_wpf_components and calls setup_wpf_theme in the same step, then calls get_wpf_project_scaffold. The scaffold returns the exact commands, including the right NuGet package for each control:
dotnet new wpf -n OrderDashboard --framework net10.0
cd OrderDashboard
dotnet add package Infragistics.WPF.DataGrids.Trial
dotnet add package Infragistics.WPF.Charts.Trial
dotnet restore
It also returns the namespaces for MainWindow.xaml:
<Window ...
        xmlns:igDP="http://infragistics.com/DataPresenter"
        xmlns:ig="http://schemas.infragistics.com/xaml"
>
The assistant ran these commands as returned and added the RoyalDark theme package from setup_wpf_theme. The namespaces are the first thing a general-purpose assistant tends to get wrong. Here they come straight from the component registry.
The scaffold uses the trial packages from nuget.org, so you can follow along without a license.
The Grid
Before it writes the grid’s XAML, the assistant looks up what it needs:
get_wpf_api_referencefor FieldSettings, FieldLayoutSettings, SummaryDefinition, CurrencyField, and XamDataGrid, for the exact property names and enum valuessearch_wpf_docsandget_wpf_docfor the record filtering, row summaries, and grouping topics, to see how those settings fit together in real XAML
The grid it wrote:
<igDP:XamDataGrid DataSource="{Binding Orders}"
                  GroupByAreaLocation="AboveDataArea"
                  IsGroupByAreaExpanded="True">
    <igDP:XamDataGrid.FieldLayoutSettings>
        <igDP:FieldLayoutSettings AutoGenerateFields="False"
                                  AutoFitMode="Always"
                                  FilterUIType="LabelIcons" />
    </igDP:XamDataGrid.FieldLayoutSettings>

    <igDP:XamDataGrid.FieldSettings>
        <igDP:FieldSettings AllowEdit="False"
                            AllowRecordFiltering="True"
                            FilterLabelIconDropDownType="MultiSelectExcelStyle"
                            AllowSummaries="True"
                            SummaryUIType="MultiSelectForNumericsOnly"
                            SummaryDisplayArea="BottomFixed, TopLevelOnly, InGroupByRecords" />
    </igDP:XamDataGrid.FieldSettings>

    <igDP:XamDataGrid.FieldLayouts>
        <igDP:FieldLayout>
            <igDP:FieldLayout.SummaryDefinitions>
                <igDP:SummaryDefinition SourceFieldName="OrderId"
                                        Calculator="{x:Static igDP:SummaryCalculator.Count}"
                                        StringFormat="Orders: {0:N0}" />
                <igDP:SummaryDefinition SourceFieldName="Amount"
                                        Calculator="{x:Static igDP:SummaryCalculator.Sum}"
                                        StringFormat="Total: {0:C2}" />
                <igDP:SummaryDefinition SourceFieldName="Amount"
                                        Calculator="{x:Static igDP:SummaryCalculator.Average}"
                                        StringFormat="Avg: {0:C2}" />
            </igDP:FieldLayout.SummaryDefinitions>

            <igDP:FieldLayout.Fields>
                <igDP:NumericField Name="OrderId" Label="Order #" Format="0" />
                <igDP:TextField Name="Customer" Label="Customer" />
                <igDP:TextField Name="Region" Label="Region" />
                <igDP:DateTimeField Name="OrderDate" Label="Order Date" Format="d" />
                <igDP:CurrencyField Name="Amount" Label="Amount" Format="C2" />
            </igDP:FieldLayout.Fields>
        </igDP:FieldLayout>
    </igDP:XamDataGrid.FieldLayouts>
</igDP:XamDataGrid>AutoFitMode, FilterUIType, FilterLabelIconDropDownType, SummaryUIType, and SummaryDisplayArea are enums, and each value above comes from the enum definitions in the API reference the server returns. The XAML compiler does not check enum values, so a near miss like LabelIcon for LabelIcons builds fine and fails only when the window loads.

Grouped by Region, with the summaries repeated in each group row and the Excel-style filter open on Customer, all from the XAML above.
The Chart
For the chart, the assistant asks get_wpf_api_reference for just the XamCategoryChart members it needs: the Y axis properties, the titles, and the properties that choose which data it plots. It also reads the “Binding to Data” and “Configuring Chart Types” docs topics. The chart it wrote:
<ig:XamCategoryChart ItemsSource="{Binding RevenueByRegion}"
                     ChartType="Column"
                     XAxisLabel="{}{Region}"
                     Title="Total Revenue by Region"
                     XAxisTitle="Region"
                     YAxisTitle="Revenue (USD)"
                     YAxisMinimumValue="0" />
It binds to a per-region total in the view model:
RevenueByRegion = Orders
    .GroupBy(o => o.Region)
    .OrderBy(g => g.Key)
    .Select(g => new RegionRevenue(g.Key, (double)g.Sum(o => o.Amount)))
    .ToList();
The prompt asks for a zero baseline because, without YAxisMinimumValue="0", the axis starts near the smallest value, and a region with half the revenue of the others looks like it sold almost nothing.
The Theme
The server tells the assistant to set up the theme before it writes any brushes or setters, so it called setup_wpf_theme for RoyalDark first, alongside the component lookups. That returns RoyalDark’s resource files and the exact steps to apply it:
dotnet add package Infragistics.WPF.Themes.RoyalDark.Trial// App.xaml.cs
protected override void OnStartup(StartupEventArgs e)
{
// Must be set before the first window is created.
Infragistics.Themes.ThemeManager.ApplicationTheme = new Infragistics.Themes.RoyalDarkTheme();
base.OnStartup(e);
}That line themes the whole app: the grid and the chart both pick up RoyalDark with no hand-written brushes. The theme files setup_wpf_theme lists include RoyalDark’s grid and chart styles, so the grid needs no separate Theme="..." setting. The window is the exception: the assistant searched RoyalDark’s standard-control styles for Window with get_wpf_theme_resource, found no style for it, and set the window background to #FF1E1E1E, a color it took from RoyalDark’s palette with get_wpf_theme_palette.
Checking the Result
After the first build, the assistant ran the app and looked at a screenshot of the window. Two things were off: the group-by area showed up only as a thin, unlabeled strip, and the columns filled only half the grid’s width, so longer customer names were cut off. It checked both fixes with get_wpf_api_reference and set two properties: IsGroupByAreaExpanded="True" on the grid and AutoFitMode="Always" on its field layout settings.

The first run, as the assistant saw it: a collapsed group-by area, and columns that fill only half the grid and cut off customer names. The screenshot at the top of this post shows the fixed version.
Refining the Dashboard with Follow-Up Prompts
The first prompt is about getting a working dashboard on the screen. Once it is working, you can keep refining it in the same session, and the server grounds each follow-up change the same way.
Change the accent color.
Keep RoyalDark, but change its accent color to our brand blue, #0078D4.This one is harder than it looks. Overriding RoyalDark’s color keys in your app’s resources does not recolor the theme, because each theme file reads its own copy of those colors. get_wpf_theme_palette returns RoyalDark’s colors together with recolor steps we verified in test apps, and the assistant followed the one for the whole app: an extended theme. It subclassed RoyalDarkTheme and pointed the grid, chart, and standard-control theme files at recolored copies in the project:
public class BrandRoyalDarkTheme : RoyalDarkTheme
{
    private static readonly string[] RecoloredFiles =
    [
        "RoyalDark.xamDataPresenter.xaml",
        "RoyalDark.xamDataChart.xaml",
        "RoyalDark.MSControls.Core.Implicit.xaml",
    ];

    protected override void ConfigureControlMappings()
    {
        base.ConfigureControlMappings();

        var assembly = typeof(BrandRoyalDarkTheme).Assembly.FullName;
        foreach (var key in Mappings.Keys.ToList())
        {
            var file = RecoloredFiles.FirstOrDefault(f => Mappings[key].EndsWith(f, StringComparison.OrdinalIgnoreCase));
            if (file != null)
                Mappings[key] = BuildLocationString(assembly, "/Themes/Brand/" + file);
        }
    }
}
App.xaml.cs now sets new BrandRoyalDarkTheme() instead of new RoyalDarkTheme(). The accent is defined in only two of the copied files, so the recolor itself is a few lines in each. RoyalDark’s accent has three purple shades, and the assistant kept each one’s role: #0078D4 for focus borders, the active filter icon, and checked boxes, a darker #005A9E for selected rows, and a lighter #2B88D8 for hyperlinks. The first chart series follows the accent, so the columns turned blue too.
It took about six minutes. The assistant ran the app and checked a selected row, the open filter dropdown, an active filter, and the chart, and found no purple left. The trade-off is the copied files: the project now carries 12 theme files and 9 grid images, and they need to be copied again when you upgrade Ultimate UI for WPF. The assistant also pointed out what still uses the stock purple: a few shared parts it did not copy, mostly carousel, tab, and tool-window parts, and gauge range colors. This app shows none of them.

RoyalDark with the brand blue accent: the chart columns follow the new accent.

The selected row and the filter checkboxes in the brand blue.
Add Export to Excel.
Add an Export to Excel button above the grid.Export to Excel is one of the first features business users ask for, and it shows the grounding well, because exporting is not part of the grid’s package. The assistant found the “Export a DataPresenter Control to Excel” and “Apply Formats for Exporting” topics with search_wpf_docs and get_wpf_doc, and get_wpf_api_reference for DataPresenterExcelExporter named the extra package it needed, Infragistics.WPF.DataGrids.Excel.Trial, along with its XAML namespace. The export itself is one line in the button’s click handler:
new DataPresenterExcelExporter().Export(OrdersGrid, dialog.FileName, WorkbookFormat.Excel2007);The assistant noted that exported cells do not carry the grid’s styling, so it used the formatting topic to give the Order Date and Amount fields Excel number formats, and made the column headers bold. These export formats are attached properties that affect only the workbook, not the grid. For Amount, that is a setting on the field:
<igDP:CurrencyField Name="Amount" Label="Amount" Format="C2">
    <igDP:CurrencyField.Settings>
        <igDP:FieldSettings>
            <igExcelExporter:DataPresenterExcelExporter.ExcelCellFormatSettings>
                <igExcelExporter:FormatSettings FormatString="$#,##0.00" />
            </igExcelExporter:DataPresenterExcelExporter.ExcelCellFormatSettings>
        </igDP:FieldSettings>
    </igDP:CurrencyField.Settings>
</igDP:CurrencyField>
The code built on the first try, and the change took about two and a half minutes. Before it reported back, the assistant exported a test workbook and read it back: bold headers, real dates and currency values instead of text, and the summary rows at the bottom.
The new Export to Excel button above the grid.

The exported workbook in Excel: bold headers, real dates, and currency values, not text.
Or just ask. Questions work too:
Which other chart types can XamCategoryChart show?The assistant answered from the ChartType values in the API reference and the “Chart Types” docs topic: eight types besides Column (Line, Spline, StepLine, Point, Area, SplineArea, StepArea, and Waterfall), plus Auto, with a short description of each. Switching is a one-attribute change to ChartType. It also said that Column is the best fit for revenue by region, because line and area types suggest a trend from one region to the next. For horizontal bars or stacked columns, it pointed to XamDataChart with series such as BarSeries and StackedColumnSeries, and to XamPieChart for pies.

The assistant’s answer, grounded in the ChartType enum and the Chart Types topic.
Why This Matters for WPF Developers
Ultimate UI for WPF is deep by design. A single XamDataGrid brings field layouts, field settings, filtering, grouping, and summaries. Across the product, there are 189 Xam* controls, more than 5,300 public controls and classes, and two theming systems.
That depth is why teams build enterprise desktop applications on it, and it is also what a general-purpose model is least likely to remember correctly. Generic AI output can look right and still fail at build time or when the window opens.
With the Infragistics WPF MCP server connected, the assistant works from the real API and documentation. That means it can focus on assembling and customizing your application instead of inventing XAML that does not exist.
Tips for Better Results
- Name the server in your first prompt. “Use the Infragistics WPF MCP server” is usually enough to make the assistant use the tools.
- Put the theme in the first prompt. Theming first saves a round of hand-written colors that the theme would replace anyway.
- Expect some variation. Different assistants and models split the work differently, so your run may not match this post step for step.
- Check what the assistant looked up. Add
"args": ["--debug"]to your client configuration, and the server logs every tool call, with its input and output, towpf-mcp.login your temp folder. - Match the data to your packages. The startup line shows which Ultimate UI for WPF version the reference data was built from.
Get Started
Install the server:
dotnet tool install -g Infragistics.Wpf.Mcp --prereleaseThen connect it to your AI assistant and try the prompt above.
Source, issues, and setup for more clients on GitHub ->
Explore Ultimate UI for WPF ->
WPF NuGet packages documentation ->
Final Thoughts
AI coding assistants can help WPF developers move faster, but only when the XAML they write is correct, down to the namespace URIs, property names, and enum values. The Infragistics WPF MCP server gives your assistant the same reference material you would look up yourself, so you spend your time reviewing a working app instead of debugging invented APIs.
Whether you work in Visual Studio, VS Code, or Claude Code, the goal is the same: build Ultimate UI for WPF applications faster, with XAML grounded in the real API. Try the prompts on your own data. If the assistant still gets something wrong, the --debug log shows exactly what it looked up, and we would like to hear about it on GitHub.


